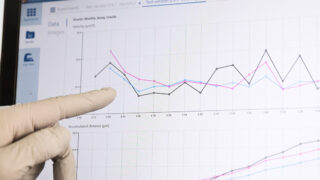
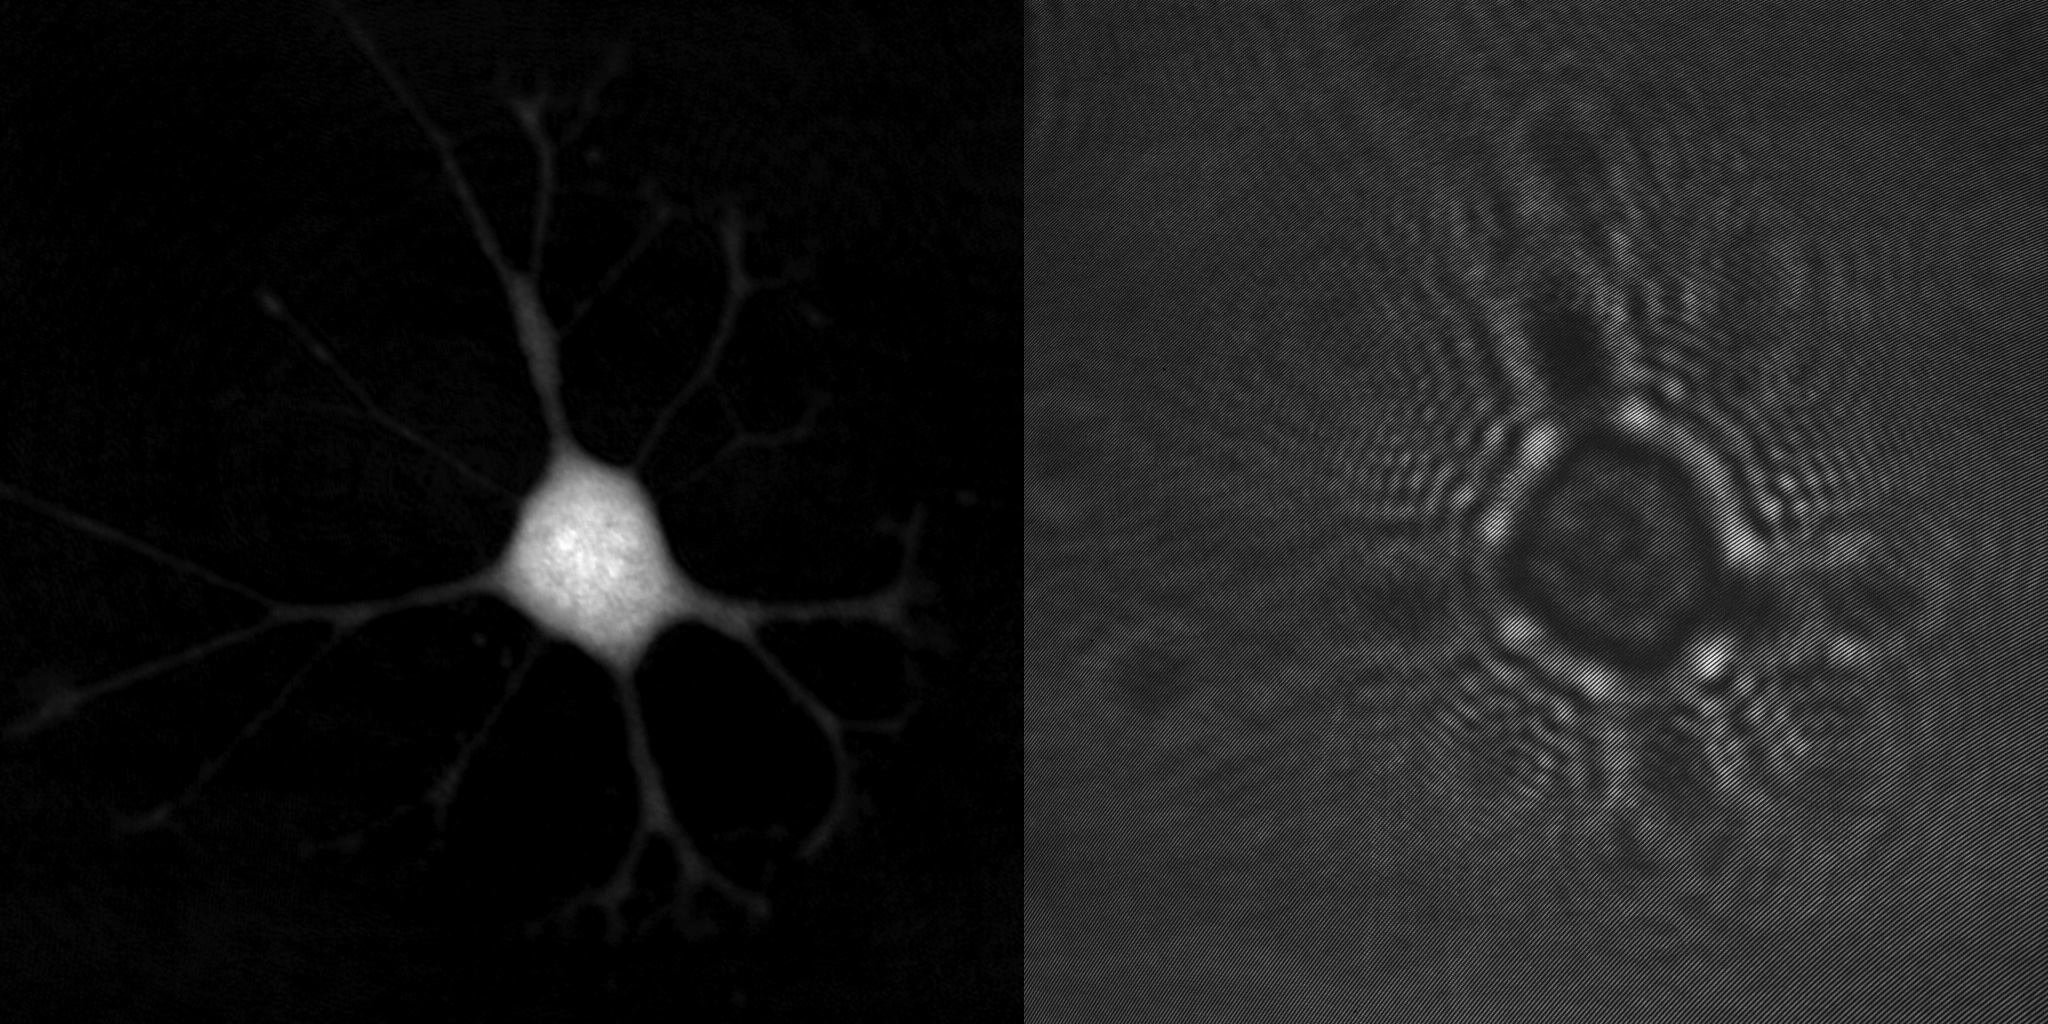
created using HoloMonitor®
Quantitative Phase Imaging
Quantitative phase imaging (QPI) or quantitative phase contrast microscopy provides both quantitative and beautiful images of living cells, transforming phase microscopy into a quantitative tool for detailed cell analysis.
Quantitative Phase Imaging vs. Phase Contrast
To illustrate the difference between quantitative phase and phase contrast microscopy images, the same living cells were imaged with both modalities. As can be been seen from the intensity profiles, the individual cells are much more easily singled out from the less confusing background in the latter quantitative phase image (B).
Humans are exceptionally good at processing visual information. The characteristic bright halo seen around cells in a phase contrast image does not bother us humans. However, computers process images very differently from us humans and rely on that the cells are distinctly separated from the background, as computers have no prior knowledge of what a cell looks like.
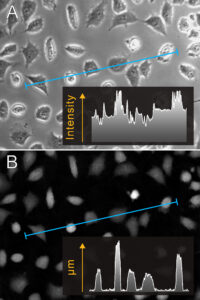
We humans have similar limitations when we are asked to find an object that we do not know how it looks like. Unless it is very obvious what distinguishes the object from the surrounding background, we will not be able to identify the object.
Optical Thickness
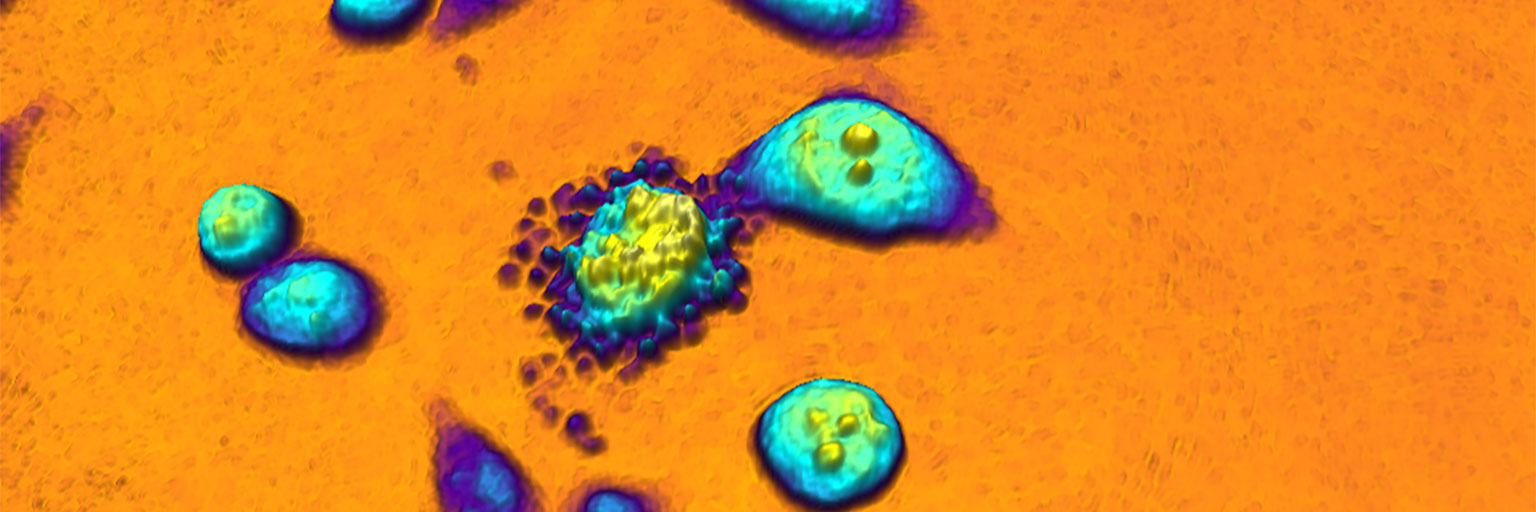
Unlike in phase contrast microscopy images, the intensity of a pixel in a phase image has a direct physical meaning. It corresponds to the optical thickness of the cell, which is the physical height of the cell multiplied by the optical density of the cell at that point. Consequently, cell structures that are optically dense like lipid droplets will appear as bright spots. Reversely, less dense objects like vacuoles will appear as dark spots within the cell.
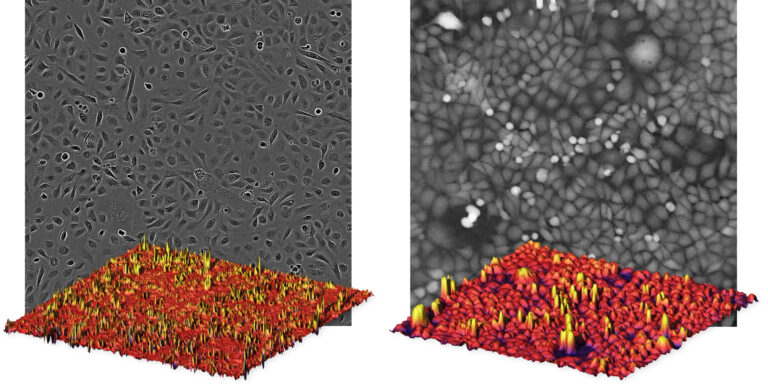
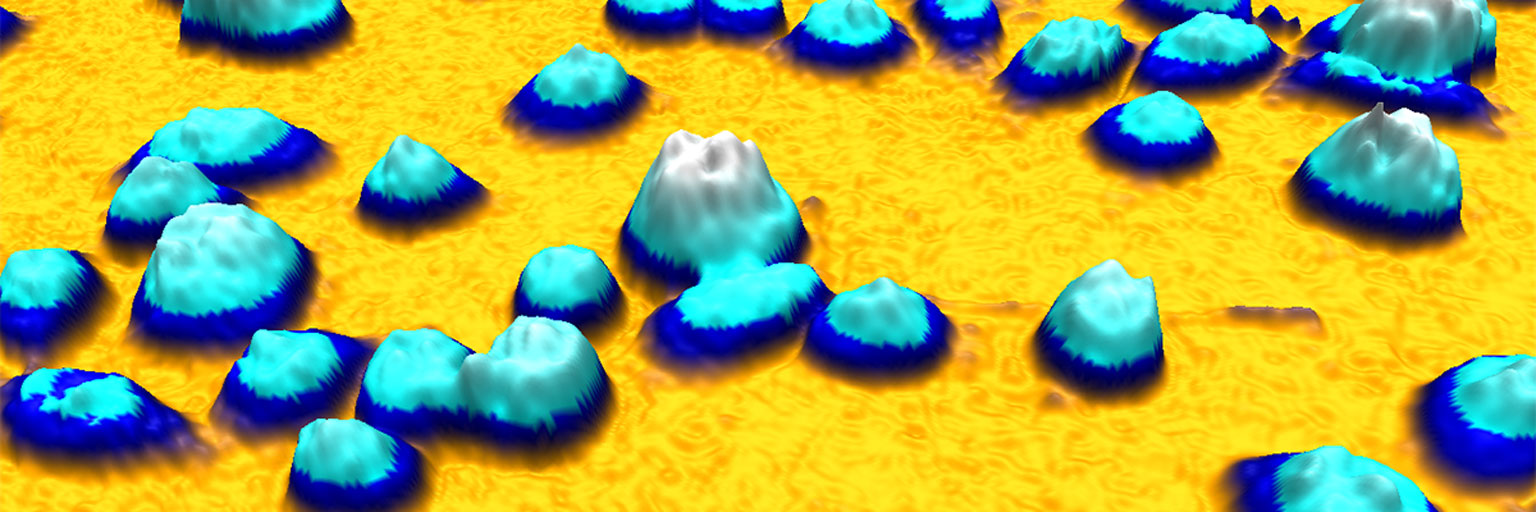
To further illustrate the benefit of quantitative phase imaging, the composite image above shows cell images taken with conventional phase contrast microscopy (left) and quantitative phase microscopy (right). Below each image, the image is also displayed as a 3-dimensional image, where the height is determined by the brightness of each pixel. In contrast to the conventional image on the left, it is easy to distinguish the individual cells in the 3-dimensional quantitative phase image to the right, in which each cell creates a peak. Which is the reason why the HoloMonitor® App Suite cell imaging software enables fully automated cell analysis, unrivaled in the industry.
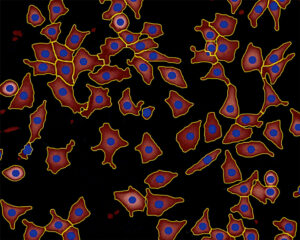
Cells identified in a quantitative phase image recorded by HoloMonitor.
Simpler Live Cell Identification
As cells appear are well separated peaks from the background in a quantitative phase image, simpler and more robust computer algorithms can be used to identify individual cells in such images.
Phase Imaging References

A Time-lapse, Label-free, Quantitative Phase Imaging Study of Dormant and Active Human Cancer Cells
Authors: Jing Huang et al.
Journal: JoVe (video journal) (2018)
Research Areas: Cancer Research
Cell Lines: KHOS
Keywords: HoloMonitor M4, Cell morphology, Cell motility, Cell migration, Cell proliferation

Applications of Label-free, Quantitative Phase Holographic Imaging Cytometry to the Development of Multi-specific Nanoscale Pharmaceutical Formulations
Authors: Ed Luther et al.
Journal: Cytometry Part A 2017 (2017)
Research Areas: Pharmacology
Cell Lines: HeLa, L929
Keywords: Review, HoloMonitor M4, Holographic imaging, Label-free, Time-lapse, 4-D imaging
